So, to help the user understand what these features are, I will discuss them here. Cross Tabs are typically a way to illustrate data in a 3 dimensional, sliceable manner. What does that mean exactly? Well, lets say, for example, that we have the following table:
(City)C1 (State)C2 (Country)C3 Sales Figure(C4)
R4
Now, lets say we want to slice this up in such a way that we take out rows, and we want to slice this up to show sales figures across State. If this were multi country, we might want an output with something like:
There are multiple variations of the above we could slice this into, but that is the basic idea. So the next question is, what is a Data Cube in BIRT? To give a simple answer, a Data Cube is a Data Source for Cross Tabs. Data Cubes define the slice axis used in the above example. A Cross Tab would be the visual representation used in a report to display your slices. In the following examples, we will look at some uses of cross tabs, and show some real world examples of how cross tabs have been used, including the little discussed uses of Attributes for groups.
Lets walk through an example.
- Create a new empty report called CrossTabExample.rptDesign
- Connect to the Classic Models sample database, and use the following query:
select

CUSTOMERS.CITY,

CUSTOMERS.STATE,

CUSTOMERS.COUNTRY,

(ORDERDETAILS.PRICEEACH * ORDERDETAILS.QUANTITYORDERED) salesSum

from

CUSTOMERS,

ORDERDETAILS,

ORDERS

where

ORDERS.ORDERNUMBER = ORDERDETAILS.ORDERNUMBER

and ORDERS.CUSTOMERNUMBER = CUSTOMERS.CUSTOMERNUMBER

- In the data cube, create the following groupings by dragging and dropping fields. For example, in the Available Fields box, drag the City column over to the Groups, where it says Drop a field here to create a group, and call that grouping GroupByCity.

- Drag the newly created Cube to the report designer. This will automatically create a Crosstab Report Item.

- Drag the State grouping to the Column area.

- Delete the City grouping (this will just save space for this example).
- Preview the report.


That is a pretty simplistic example. A more relevant one would be a display of quarter sales per country. So, lets modify the above example.
- Modify the query to the following, adding the date field:
   1. select

CUSTOMERS.CITY,

CUSTOMERS.STATE,

CUSTOMERS.COUNTRY,

(ORDERDETAILS.PRICEEACH * ORDERDETAILS.QUANTITYORDERED) salesSum,

CLASSICMODELS.ORDERS.ORDERDATE

from

CUSTOMERS,

ORDERDETAILS,

ORDERS

where

ORDERS.ORDERNUMBER = ORDERDETAILS.ORDERNUMBER

and ORDERS.CUSTOMERNUMBER = CUSTOMERS.CUSTOMERNUMBER- In the Data Cube, add the ORDERDATE as a group, and set the grouping to Quarter. This prompt is unique to dates.

- Remove the State column from the Crosstab.
- Drag the ORderDate Group to the newly empty Column.

- Preview the report

Now that is a cross tab that is a little more usable. Here we can see sales for each country based on Quarter of the year.
Cross tabs also have some really interesting uses that are not very apparent. For example, lets say you want to display the values of rows as columns. This works just fine. In the following example, lets say we want the names of employees to show as column, with tables below each name showing their customers.
1. Create a new report called EmployeeCustomers.rptDesign.
2. Create a Data Source connecting to the Classic Models example database, and a new data set using the following query:
selectCLASSICMODELS.EMPLOYEES.EMPLOYEENUMBER,
CLASSICMODELS.EMPLOYEES.LASTNAME,
CLASSICMODELS.EMPLOYEES.FIRSTNAME
from
CLASSICMODELS.EMPLOYEES
3. Create a new Data Cube. Drag over the LastName as a grouping.
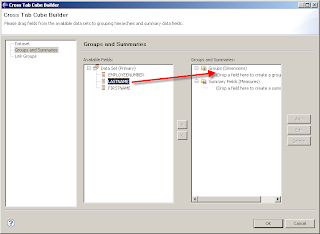
4. Double click on the LastName grouping to open the editor. For the display field use the following expression:

5. Click on the Add for Attributes. Add in the EmployeeNumber. The reason for this is that we will need to be able to access the EmployeeNumber in the crosstab to filter the child tables.

6. Drag the newly created Data Cube to the report designer. Drag the LastName column over to the Column Area. This will display all employee names as columns instead of rows.

7. Create a new Data Set. Use the following query. Be sure to leave the parameter as empty, as it will be set by our Crosstab.
selectCUSTOMERS.CUSTOMERNAME
from
CUSTOMERS
where
CUSTOMERS.SALESREPEMPLOYEENUMBER = ?
8. From the outline view, select the cell that the LastName element is in for the cross tab, right-mouse click, and choose Insert/Table.

9. Create the table as 1 row, 1 column, and Data Set to the employeeCustomers table that was create in step 2.

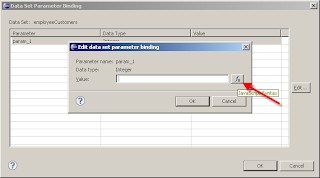
10. Now, we need to do something a little tricky here to filter this table. Select the table in the Report Editor. In the Property view, select Bindings.

11. Open the Data Set Parameter Binding dialog by clicking on the button.
12. select Param_1, and click Edit.
13. Click on the Function button in the Edit Data Set Parameter Binding dialog
14. We will need to add a new data binding for our cross tab. So Select edit bindings.

15. From the Edit Data Binding dialog, click on Add.
16. Set the name to employeeNumber, type to Integer, and expression to dimension["GroupByLastName"]["LASTNAME"]["EMPLOYEENUMBER"]. You can use the Expression Editor to set this expression. When you go through the navigation, you will notice that EmployeeNumber is listed under the group. The reason being, we added it as an attribute for the LAstName grouping.

17. Now that the crosstab binding has been created, we can hit OK for the dialogs until we get back to the Expression Editor for the Parameter Binding. The employeeNumber field is now available.

18. Now, drag the CustomerName field into the detail section of the table.

And once you apply some formatting, you are set. You are now using the rows of a table as columns, and driving a detail table with that.
- In the Data Cube, add the ORDERDATE as a group, and set the grouping to Quarter. This prompt is unique to dates.


