The requirements are for a simple Excel spreadsheet report that gives a list of all employees who meet simple criteria, and drill down from top-most level of the hierarchy to the lower level. Level numbers are down in the query itself. I prefer the Pivot table as a report format since it allows report recipients to perform some basic analysis on certain aspects without having to re-run the entire report. For example, if they are looking at the top most portion, it will give a grand total of all lower levels, however when they drill-down, the totals will automatically update to reflect the new view. They can also drag grouping categories around and have the numbers update as well. I will demonstrate this at the end of the article.
I will skip the query creation part, so for this example just know that I have already created a query that will return my list of people. The way to plug this into e-Spreadsheet is pretty straightforward. You will need to have either a JDBC or ODBC connection to your data source (note: if you want to post the report to Actuates I-Server, you will have to use JDBC, and the JDBC drivers will need to be setup on the server). I will use JDBC for this example since I already have the JDBC data sources ready to go, and I will end up posting this to I-Server.
The first step is to open e-Spreadsheet. Once open, you will see an interface very similar to just about every other spreadsheet program in existence, so there are no real surprises. The first step is to create the data source and insert the query. First, go up to Data, and then select Data Manager.
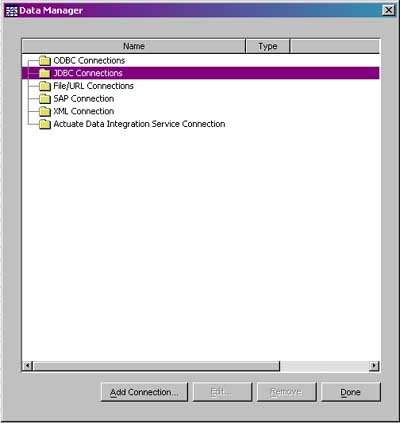
Figure 1. The Data Manager
Once inside of the Data Manager, Select JDBC Connections and click on the Add Connection button. A dialog pops up for you to fill out the JDBC URL. Below is an example I use for the Oracle JDBC driver. If this is the first time e-Spreadsheet is run, this will be blank. However, once you put in a JDBC connection, e-Spreadsheet will remember it for future use.

Figure 2. JDBC Connection Dialog
Once the data source is setup, now you need to create the query. Click on the newly created connection, and click on the “Add Query Button”. You will be given a dialog box with a large text field to type in the query. Put your respective query in. At this point, you can change the appearance of field names using the fields tab, change the query name (helpful if you have a large number of queries in your reports), or even preview the returned results. If the query is not valid, you will receive an error if you try to change tabs, or hit close. There is also an additional graphical query editor, however I never use it myself since typically my queries are not simplistic enough for it. You can also add parameters to the query to make things a little more dynamic.
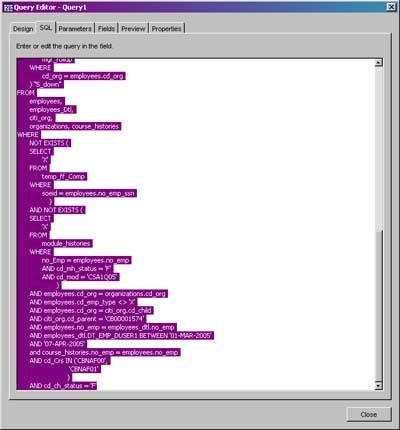
Figure 3: Query Editor
Once complete, I am now ready to put the Pivot Table into the report itself. To do this, Go up to the menu, and click on the Pivot Range Wizard. Choose External Data Source on the first prompt, as illustrated in Figure 4.

Figure 4: Pivot Range Source
The next prompt asks you to pick your external data source. Choose the query you just created and click Next. On the next screen it will ask you for the target for the pivot table to be inserted. I will keep the default range, and I will keep the options default. However, using the options dialog, you can remove grand total rows, insert values for cells with null or invalid data, disable the drilldown capabilities, and various other formatting options.

Figure 5: Target for Pivot Range
Once the wizard is complete, you will have a blank pivot table as indicated in Figure 6. To add to the pivot table, simply drag fields into it, in order of drill down hierarchy. In this example, I want to create a horizontal drill down with no vertical categories, so I will drag the levels of drill down over to the far left. The detail will be based on the individual employees, so I drag the ID number field to the main data field.
Figure 6: Empty Pivot Table
Now that the report is built, I can either run it by going up to the Data Menu, and clicking on Run Report, or posting to Actuate I-Server and retrieving from there. The advantage to I-Server is I can now schedule this report to run on regular intervals, save each report iteration using I-Servers CMS versioning scheme, and use custom URL’s to expose the report to users outside of the Active Portal and integrate it into my custom portal. The report will run from I-Server and display a Microsoft Excel spreadsheet, whereas if you run the report in the report designer, you will have to do a Save As to save as an Excel formatted file.
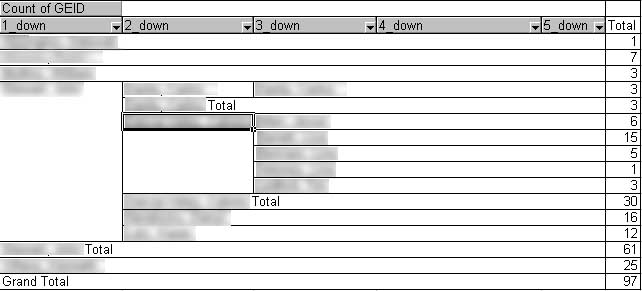
Figure 7: Completed Pivot Table
Figure 7 shows the completed report in Excel. As you can see I have drilled down on the 4th row. There are sub-totals for each level of the drill down. If I were to double click on the numbers in the total column, I would open up a separate worksheet detailing all of the employees represented by that number. This provides a quick and easy way for managers to quickly narrow down particular populations while still getting an accurate representation of the whole. The can also click on the drop down arrow on each column and remove items that they do not wish to view. Of course, using trickery with Actuate Active Portal, I-Server, and some custom programming, you can have a manger authenticate into a web portal, click on the report, and use their user id or granted roles to generate a custom report limiting the information they see. Of course, this is a little easier to accomplish in Actuate flagship product, Enterprise Report Designer, however you pay for the power in terms of ease of use.
Overall, I would about 95 percent of my current report generation is done using Actuates e-Spreadsheet and I-Server products. These are very powerful products to consider for any MIS manager whose target audience prefers reports in Excel format.


1 comment:
Excellent post. Thanks.
-- Go Actuate Go--
Post a Comment